euclidean_polygonal_surfaces#
The category of surfaces built by gluing Euclidean polygons.
See flatsurf.geometry.categories for a general description of the
category framework in sage-flatsurf.
Normally, you won’t create this (or any other) category directly. The correct category is automatically determined for immutable surfaces.
EXAMPLES:
sage: from flatsurf import MutableOrientedSimilaritySurface
sage: C = MutableOrientedSimilaritySurface(QQ).category()

sage: from flatsurf.geometry.categories import EuclideanPolygonalSurfaces
sage: C.is_subcategory(EuclideanPolygonalSurfaces())
True
- class flatsurf.geometry.categories.euclidean_polygonal_surfaces.EuclideanPolygonalSurfaces[source]#
The category of surfaces built by gluing Euclidean polygons (or more generally, polygons in two-dimensional real space).
EXAMPLES:
sage: from flatsurf.geometry.categories import EuclideanPolygonalSurfaces
sage: EuclideanPolygonalSurfaces()
Category of euclidean polygonal surfaces
- class ParentMethods[source]#
Provides methods available to all surfaces that are built from polygons in the real plane.
If you want to add functionality for such surfaces you most likely want to put it here.
- graphical_surface(*args, **kwargs)[source]#
Return a graphical representation of this surface.
This method can be used to further configure or augment a plot beyond the possibilities of
plot().The documentation of sage-flatsurf contains a section of example plots or consult the
flatsurf.graphical.surfacereference for all the details.EXAMPLES:
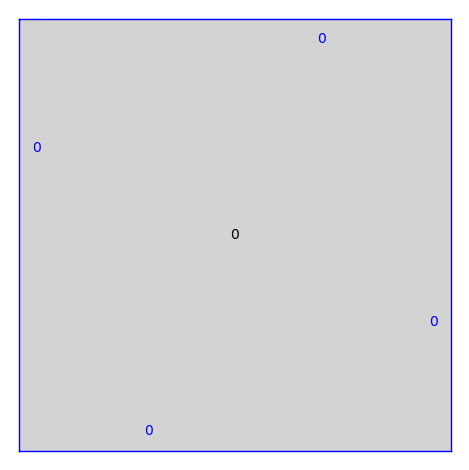
sage: from flatsurf import translation_surfaces
sage: S = translation_surfaces.square_torus()
sage: S.graphical_surface()
Graphical representation of Translation Surface in H_1(0) built from a square
- plot(**kwargs)[source]#
Return a plot of this surface.
The documentation of sage-flatsurf contains a section of example plots or consult the
flatsurf.graphical.surfacereference for all the details.EXAMPLES:
sage: from flatsurf import translation_surfaces
sage: S = translation_surfaces.square_torus()
sage: S.plot()
Graphics object consisting of 10 graphics primitives

- plot_polygon(label, graphical_surface=None, plot_polygon=True, plot_edges=True, plot_edge_labels=True, edge_labels=None, polygon_options={'axes': True}, edge_options=None, edge_label_options=None)[source]#
Returns a plot of the polygon with the provided label.
Note that this method plots the polygon in its coordinates as opposed to graphical coordinates that the :func:
plotmethod uses. This makes it useful for visualizing the natural coordinates of the polygon.INPUT:
graphical_surface– (defaultNone) If provided this function pulls graphical options from the graphical surface. If not provided, we use the default graphical surface.plot_polygon– (defaultTrue) If True, we plot the solid polygon.polygon_options– (default{"axes":True}) Options for the rendering of the polygon. These options will be passed toplot_polygon(). This should be either None or a dictionary.plot_edges– (defaultTrue) If True, we plot the edges of the polygon as segments.edge_options– (defaultNone) Options for the rendering of the polygon edges. These options will be passed toplot_edge(). This should be either None or a dictionary.plot_edge_labels– (defaultTrue) If True, we plot labels on the edges.edge_label_options– (defaultNone) Options for the rendering of the edge labels. These options will be passed toplot_edge_label(). This should be either None or a dictionary.edge_labels– (defaultNone) If None and plot_edge_labels is True, we write the edge number on each edge. Otherwise edge_labels should be a list of strings of length equal to the number of edges of the polygon. The strings will be printed on each edge.
EXAMPLES:
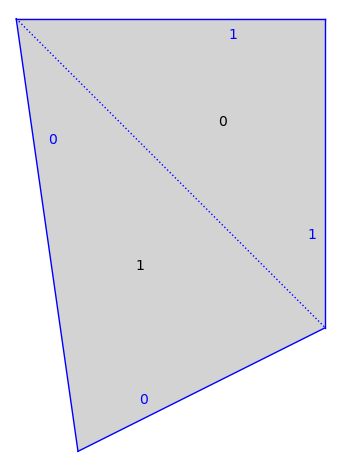
sage: from flatsurf import similarity_surfaces
sage: s = similarity_surfaces.example()
sage: s.plot()
...Graphics object consisting of 13 graphics primitives

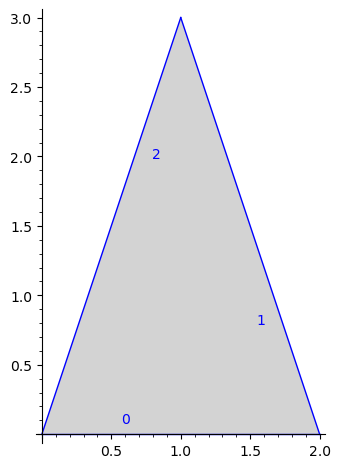
sage: s.plot_polygon(1)
...Graphics object consisting of 7 graphics primitives

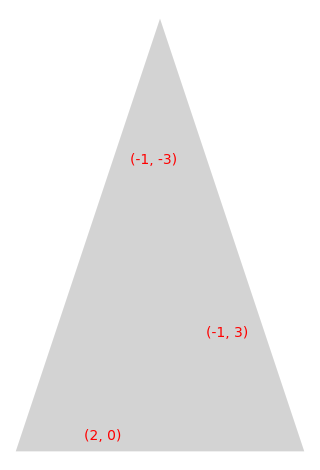
sage: labels = []
sage: p = s.polygon(1)
sage: for e in range(len(p.vertices())):
....:     labels.append(str(p.edge(e)))
sage: s.plot_polygon(1, polygon_options=None, plot_edges=False, edge_labels=labels, edge_label_options={"color":"red"})
...Graphics object consisting of 4 graphics primitives

- super_categories()[source]#
The categories such surfaces are also automatically contained in, namely the category of surfaces built from polygons.
EXAMPLES:
sage: from flatsurf.geometry.categories import EuclideanPolygonalSurfaces
sage: C = EuclideanPolygonalSurfaces()
sage: C.super_categories()
[Category of polygonal surfaces]